 The Chancy Islands
  Menu
Menu
Visualizing the Results
A Single Run of the Model
To visualize the results of the spreadsheet model, we plot the level of wealth for each household at two times: Year 0 (green dots) and Year 50 (brown dots). This graph shows the results of a single, typical run of the Chancy Islands model for Rugged Island:
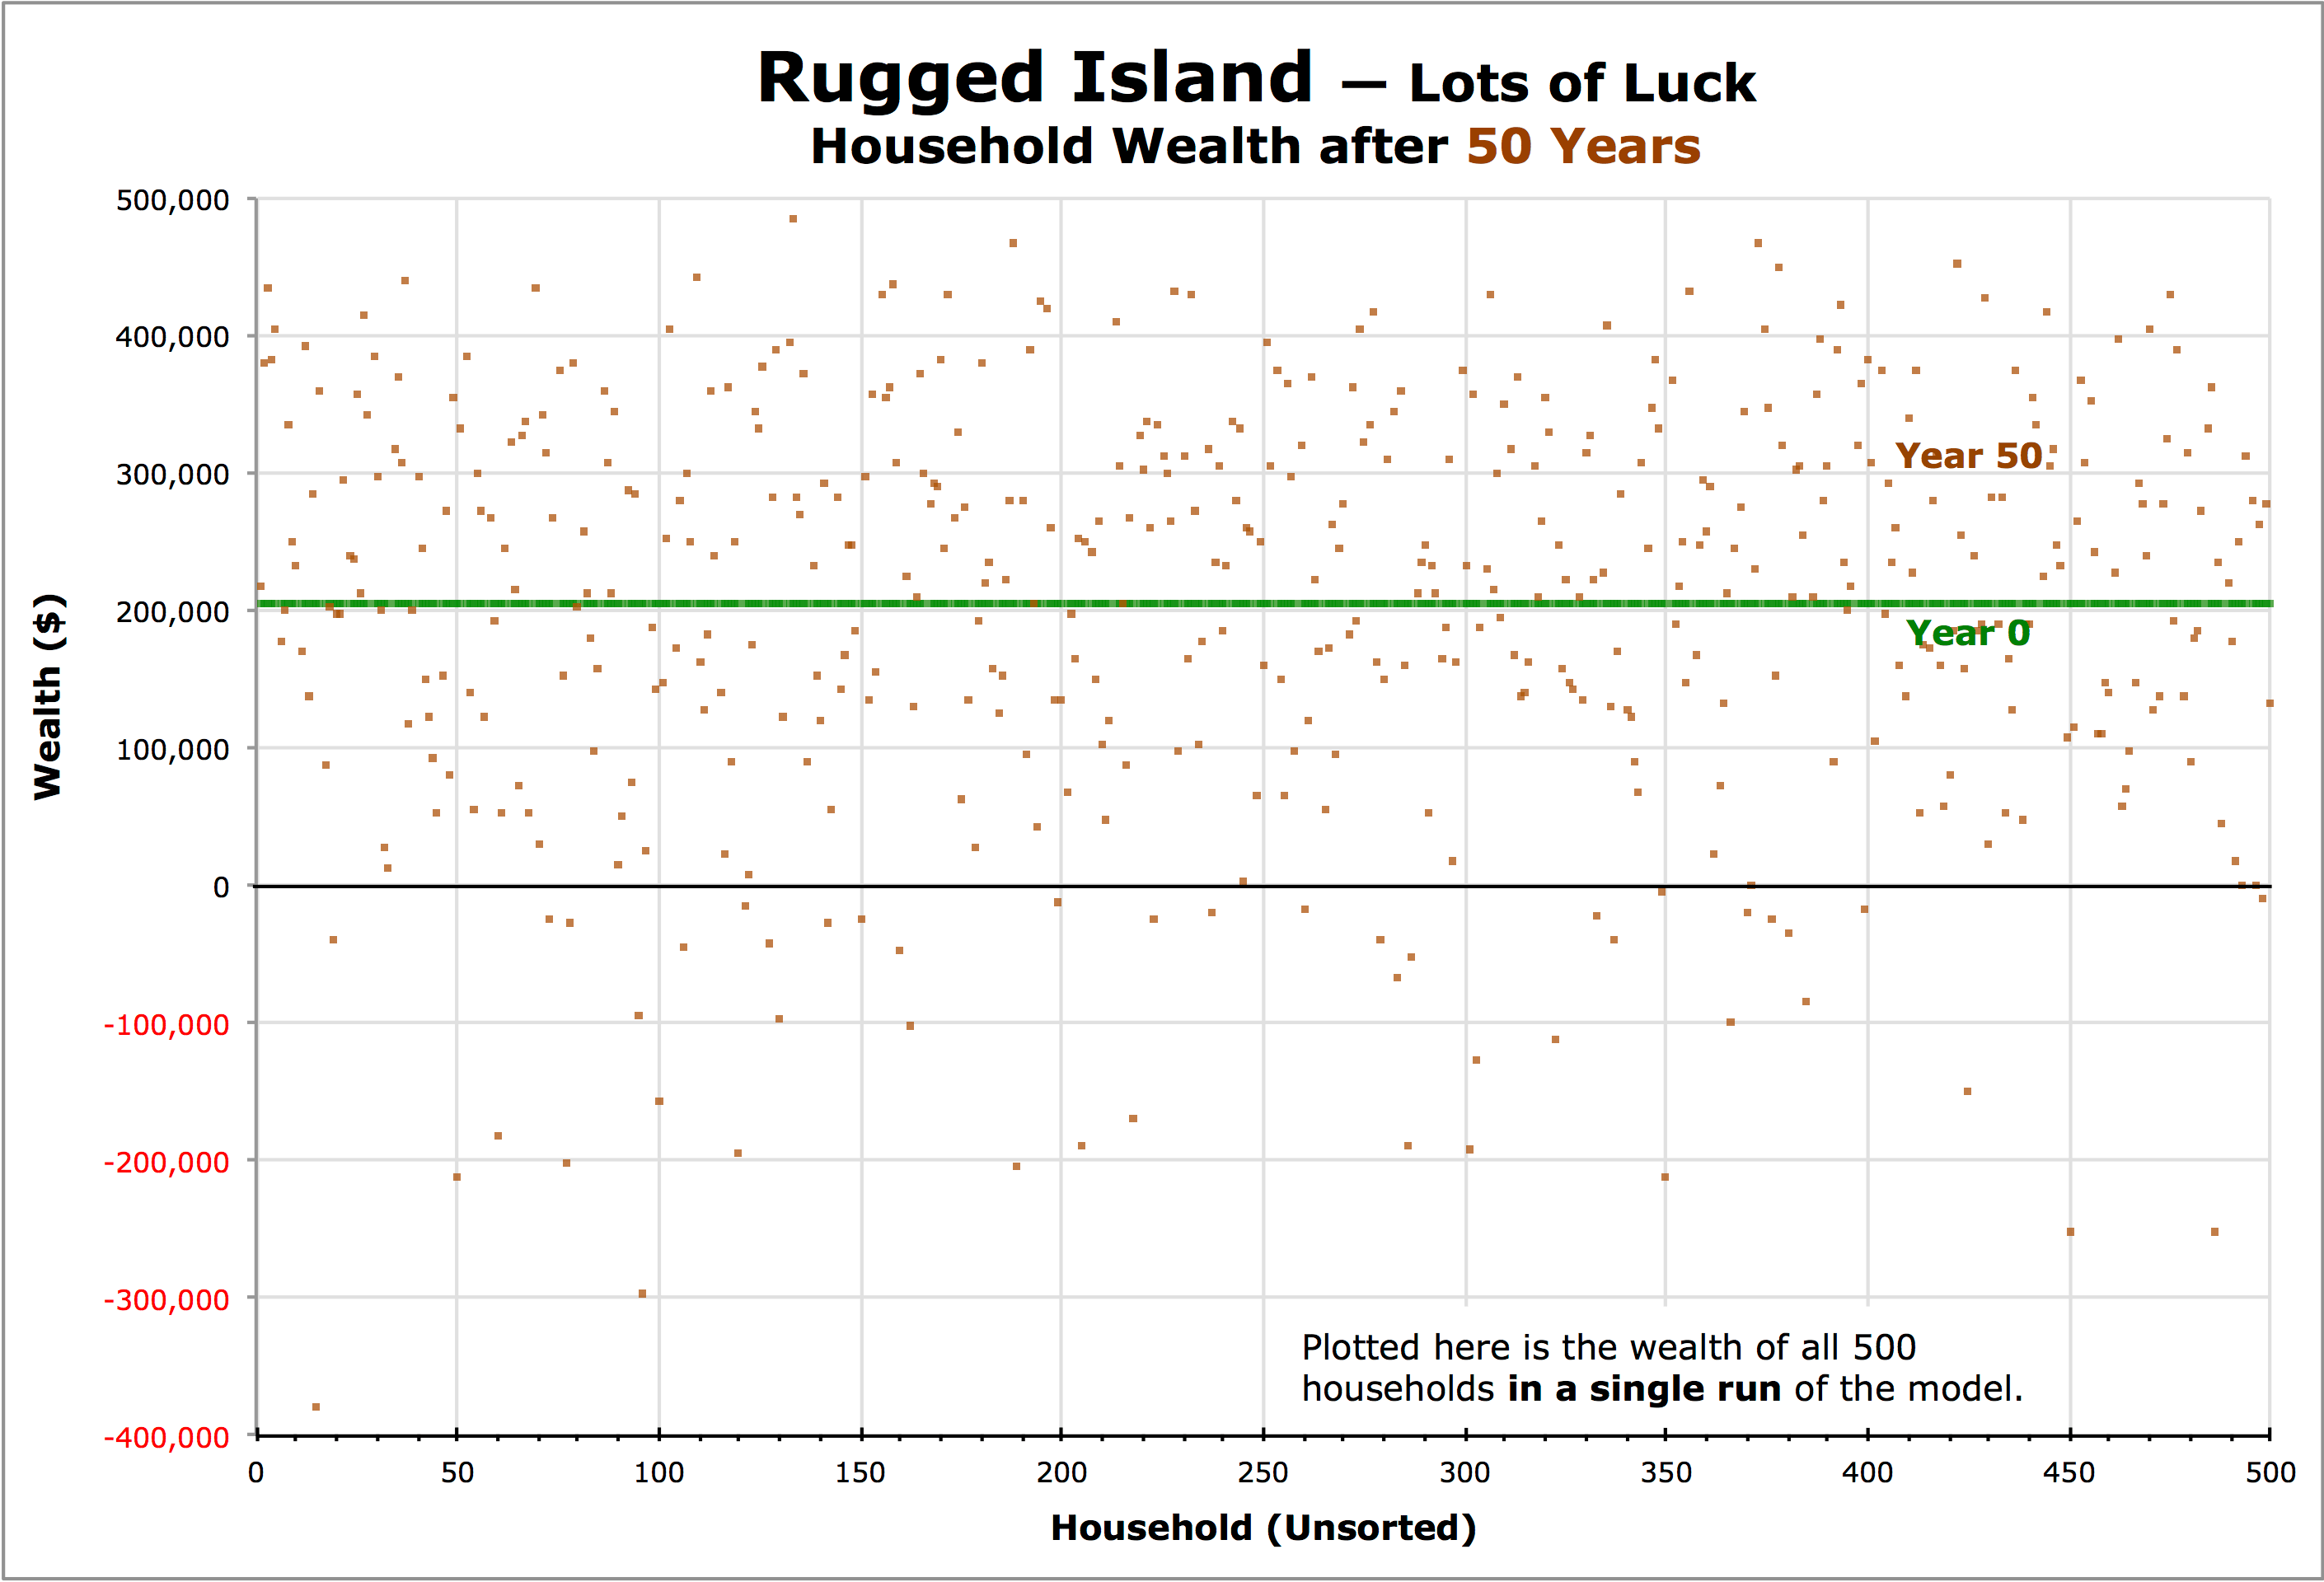
Since all 500 households on Rugged Island begin with $205,000 of wealth in Year 0, the green dots appear to form a straight horizontal line. Since unexpected expenses and catastrophic losses occur randomly over the ensuing 50 years on Rugged Island, the brown dots appear to be distributed quite randomly.
Sorting by Wealth
If we sort the households by their wealth in the Year 50, the results are easier to understand:
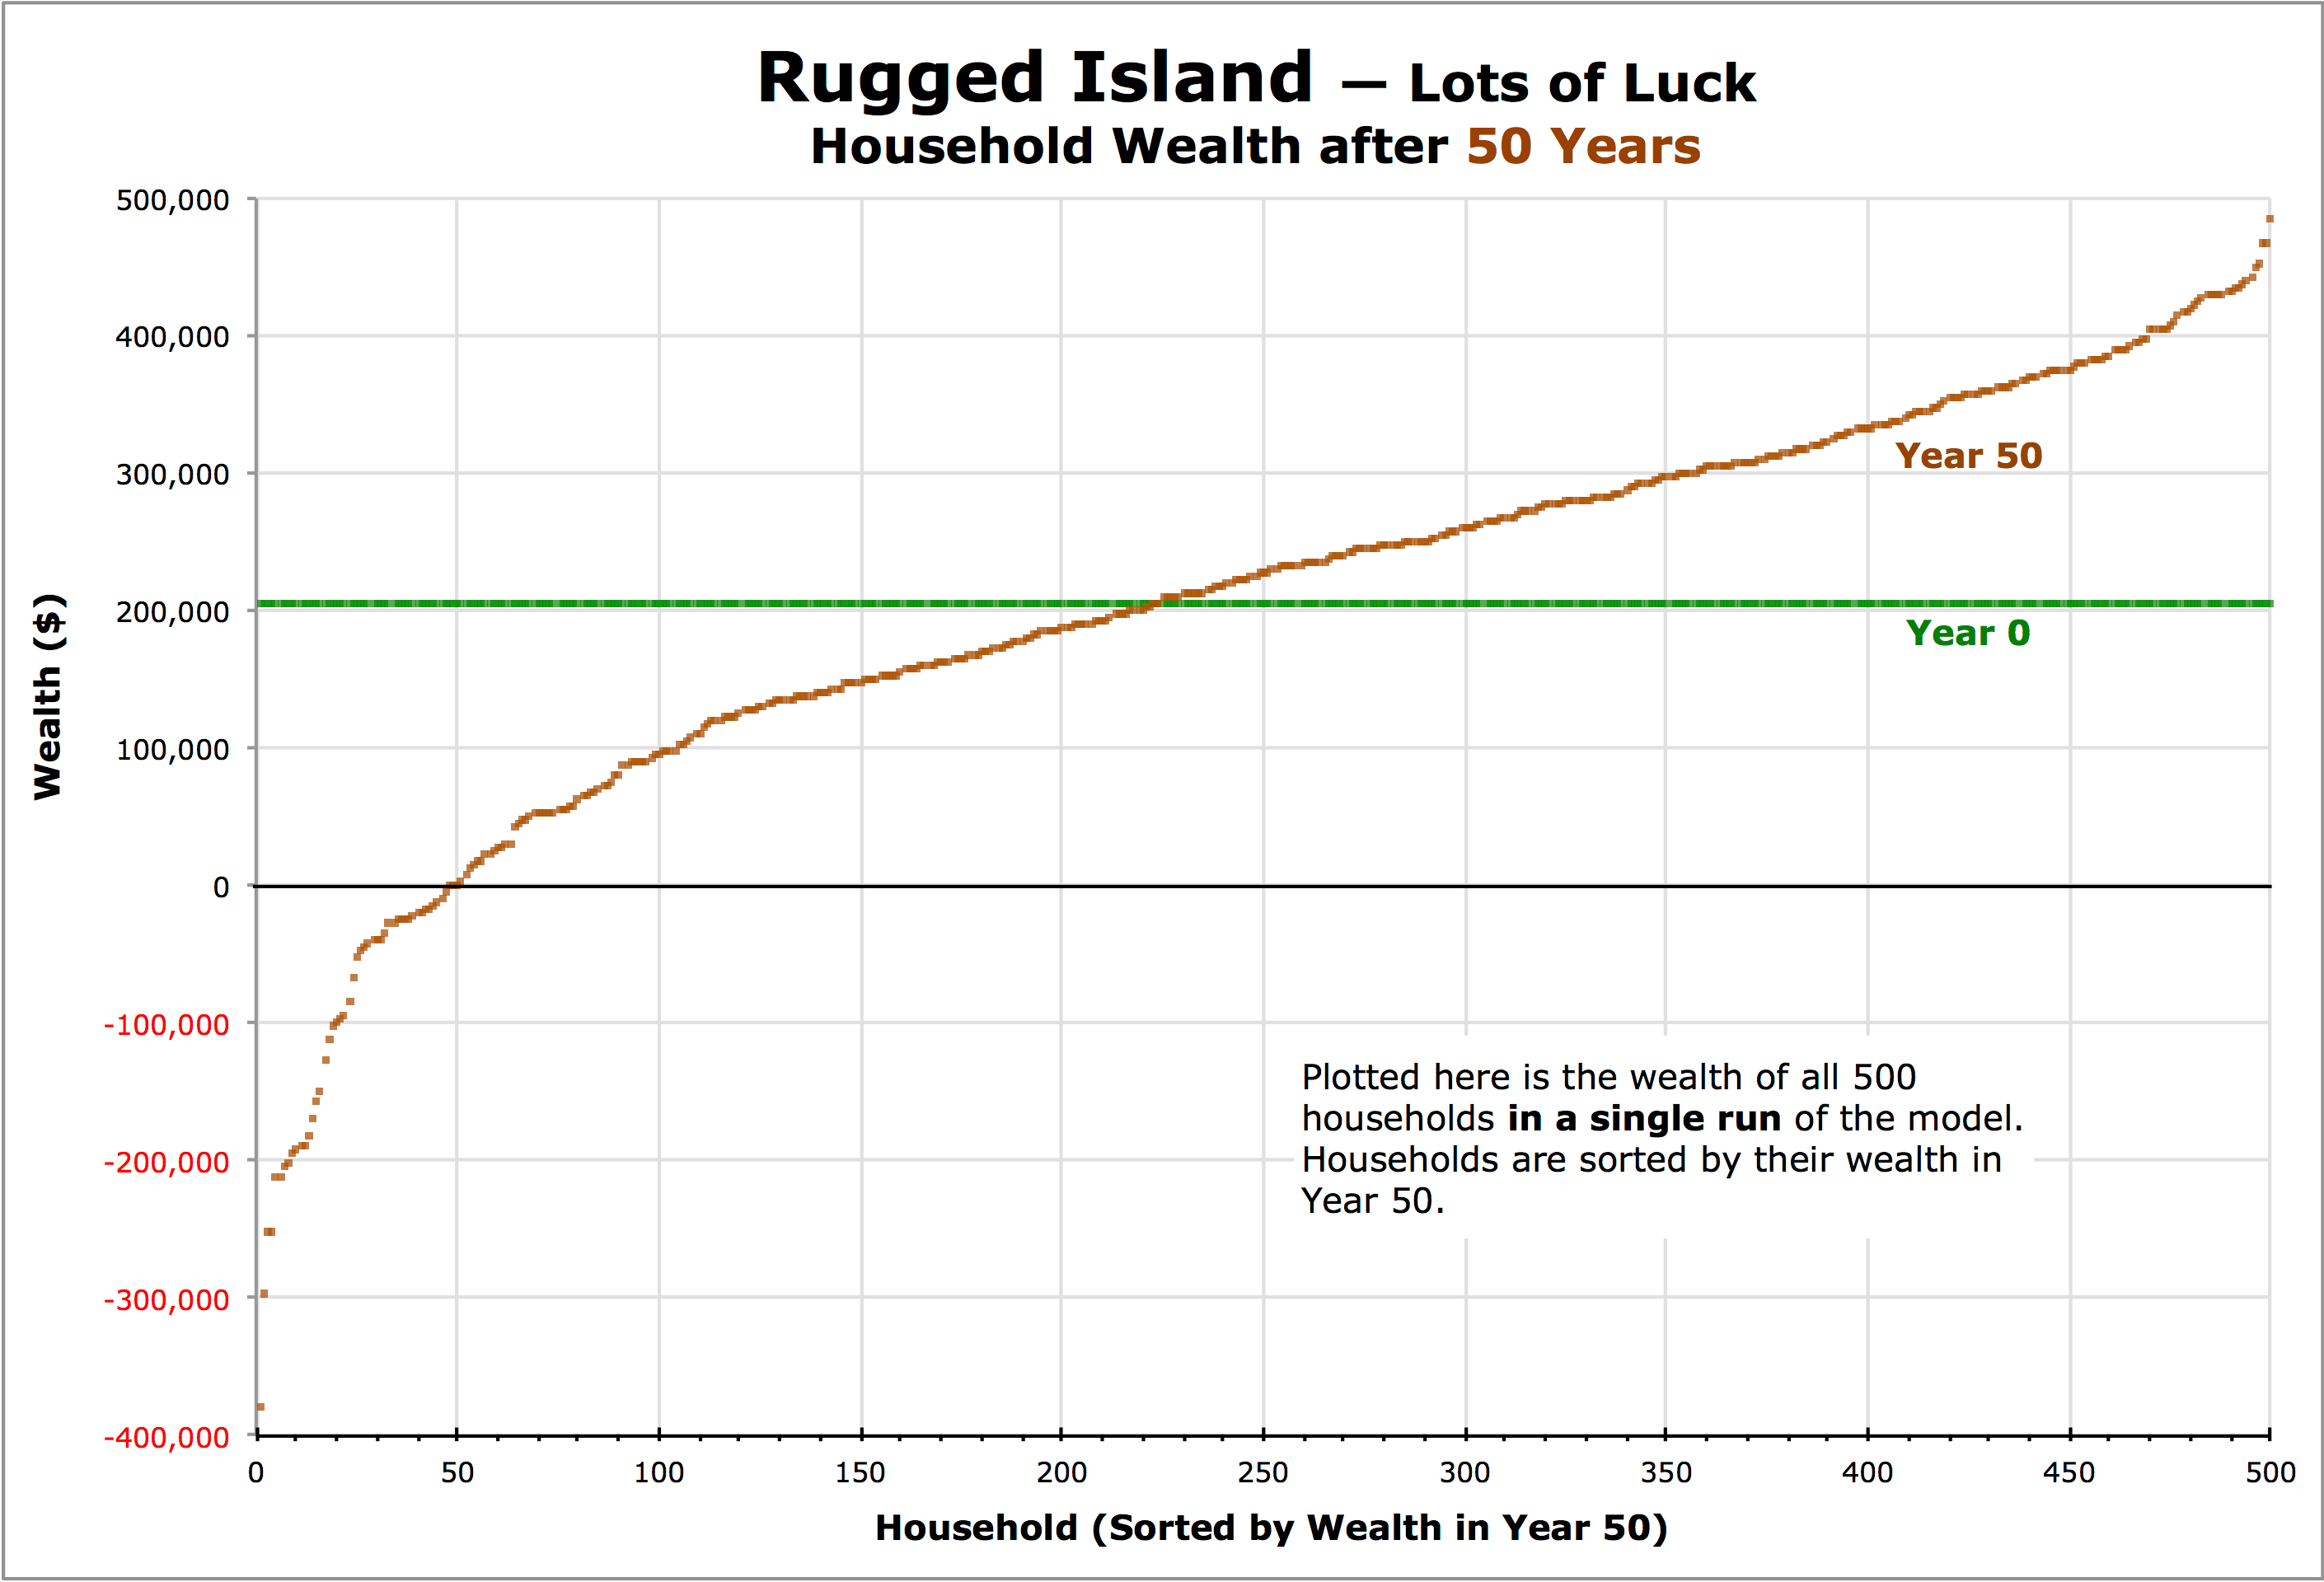
Now the brown dots trace out a somewhat ragged and disjointed curve from the lower left (poorest households) to the upper right (richest households). Since unexpected expenses and catastrophic losses are random, every run of the model produces different values, but every run produces a curve that is somewhat like this one.
Averaging 30 Runs to Smooth the Curve
If we run the model 30 times, sort the results by household wealth in the Year 50, and then average the results — with the wealth of the poorest household in each run averaged together, the wealth of the second-poorest in each run averaged together, and so on — the resulting graph is much smoother:

This produces a distinctive curve that appears to be characteristic of Rugged Island: every set of 30 runs — sorted and averaged in this way — produces a curve very similar to this one.
 Back to the Rugged Island Page