 The Chancy Islands
  Menu
Menu
Do It Yourself
Download the Chancy Islands Model
The Chancy Islands model is a very simple spreadsheet consisting of nine worksheets. To run the model with different input parameters, a version of the spreadsheet called ChancyIslandsModel10 is available for download from GoogleDocs.
GoogleDocs only allows 40,000 cells with formulas, so most of the formulas in this version of the spreadsheet have been deleted — the formulas are only complete for the first 10 households. To recreate the spreadsheet for 500 households, first download this file and open it in a spreadsheet program. Then, on each of the first 8 worksheets, copy the formulas in Row 45 (Household 10) down to all the rows through Row 535 (Household 500) in the columns from Column C to Column CX.
To use the model, change the parameters (in cells with a light blue background) on the first worksheet (called “Wealth”). There are 12 paramenters in Column A from Row 10 to Row 27 and another 500 in Column B from Row 36 to Row 535 (Initial Wealth Amount for each household). Do not change the values in cells with a light yellow background — these are linked to the blue cells on the first page. Note that the Average Initial Wealth in Cell A8 is a calculated value, not an initial paramenter.
The results for one run of the model are displayed on the last worksheet (“Results”). To calculate the values for the Chancy Islands shown on this website, we used another spreadsheet (powered by Excel’s Visual Basic macros) that ran the model 30 times, then sorted those runs by the results in Year 50 and averaged the results.
Random Extra Expenses and Catastrophic Losses
To simulate Extra Expenses and Catastrophic Losses that strike randomly and occur infrequently (with the greatest expenses/losses occurring the least frequently), the model uses an exponential decay function:
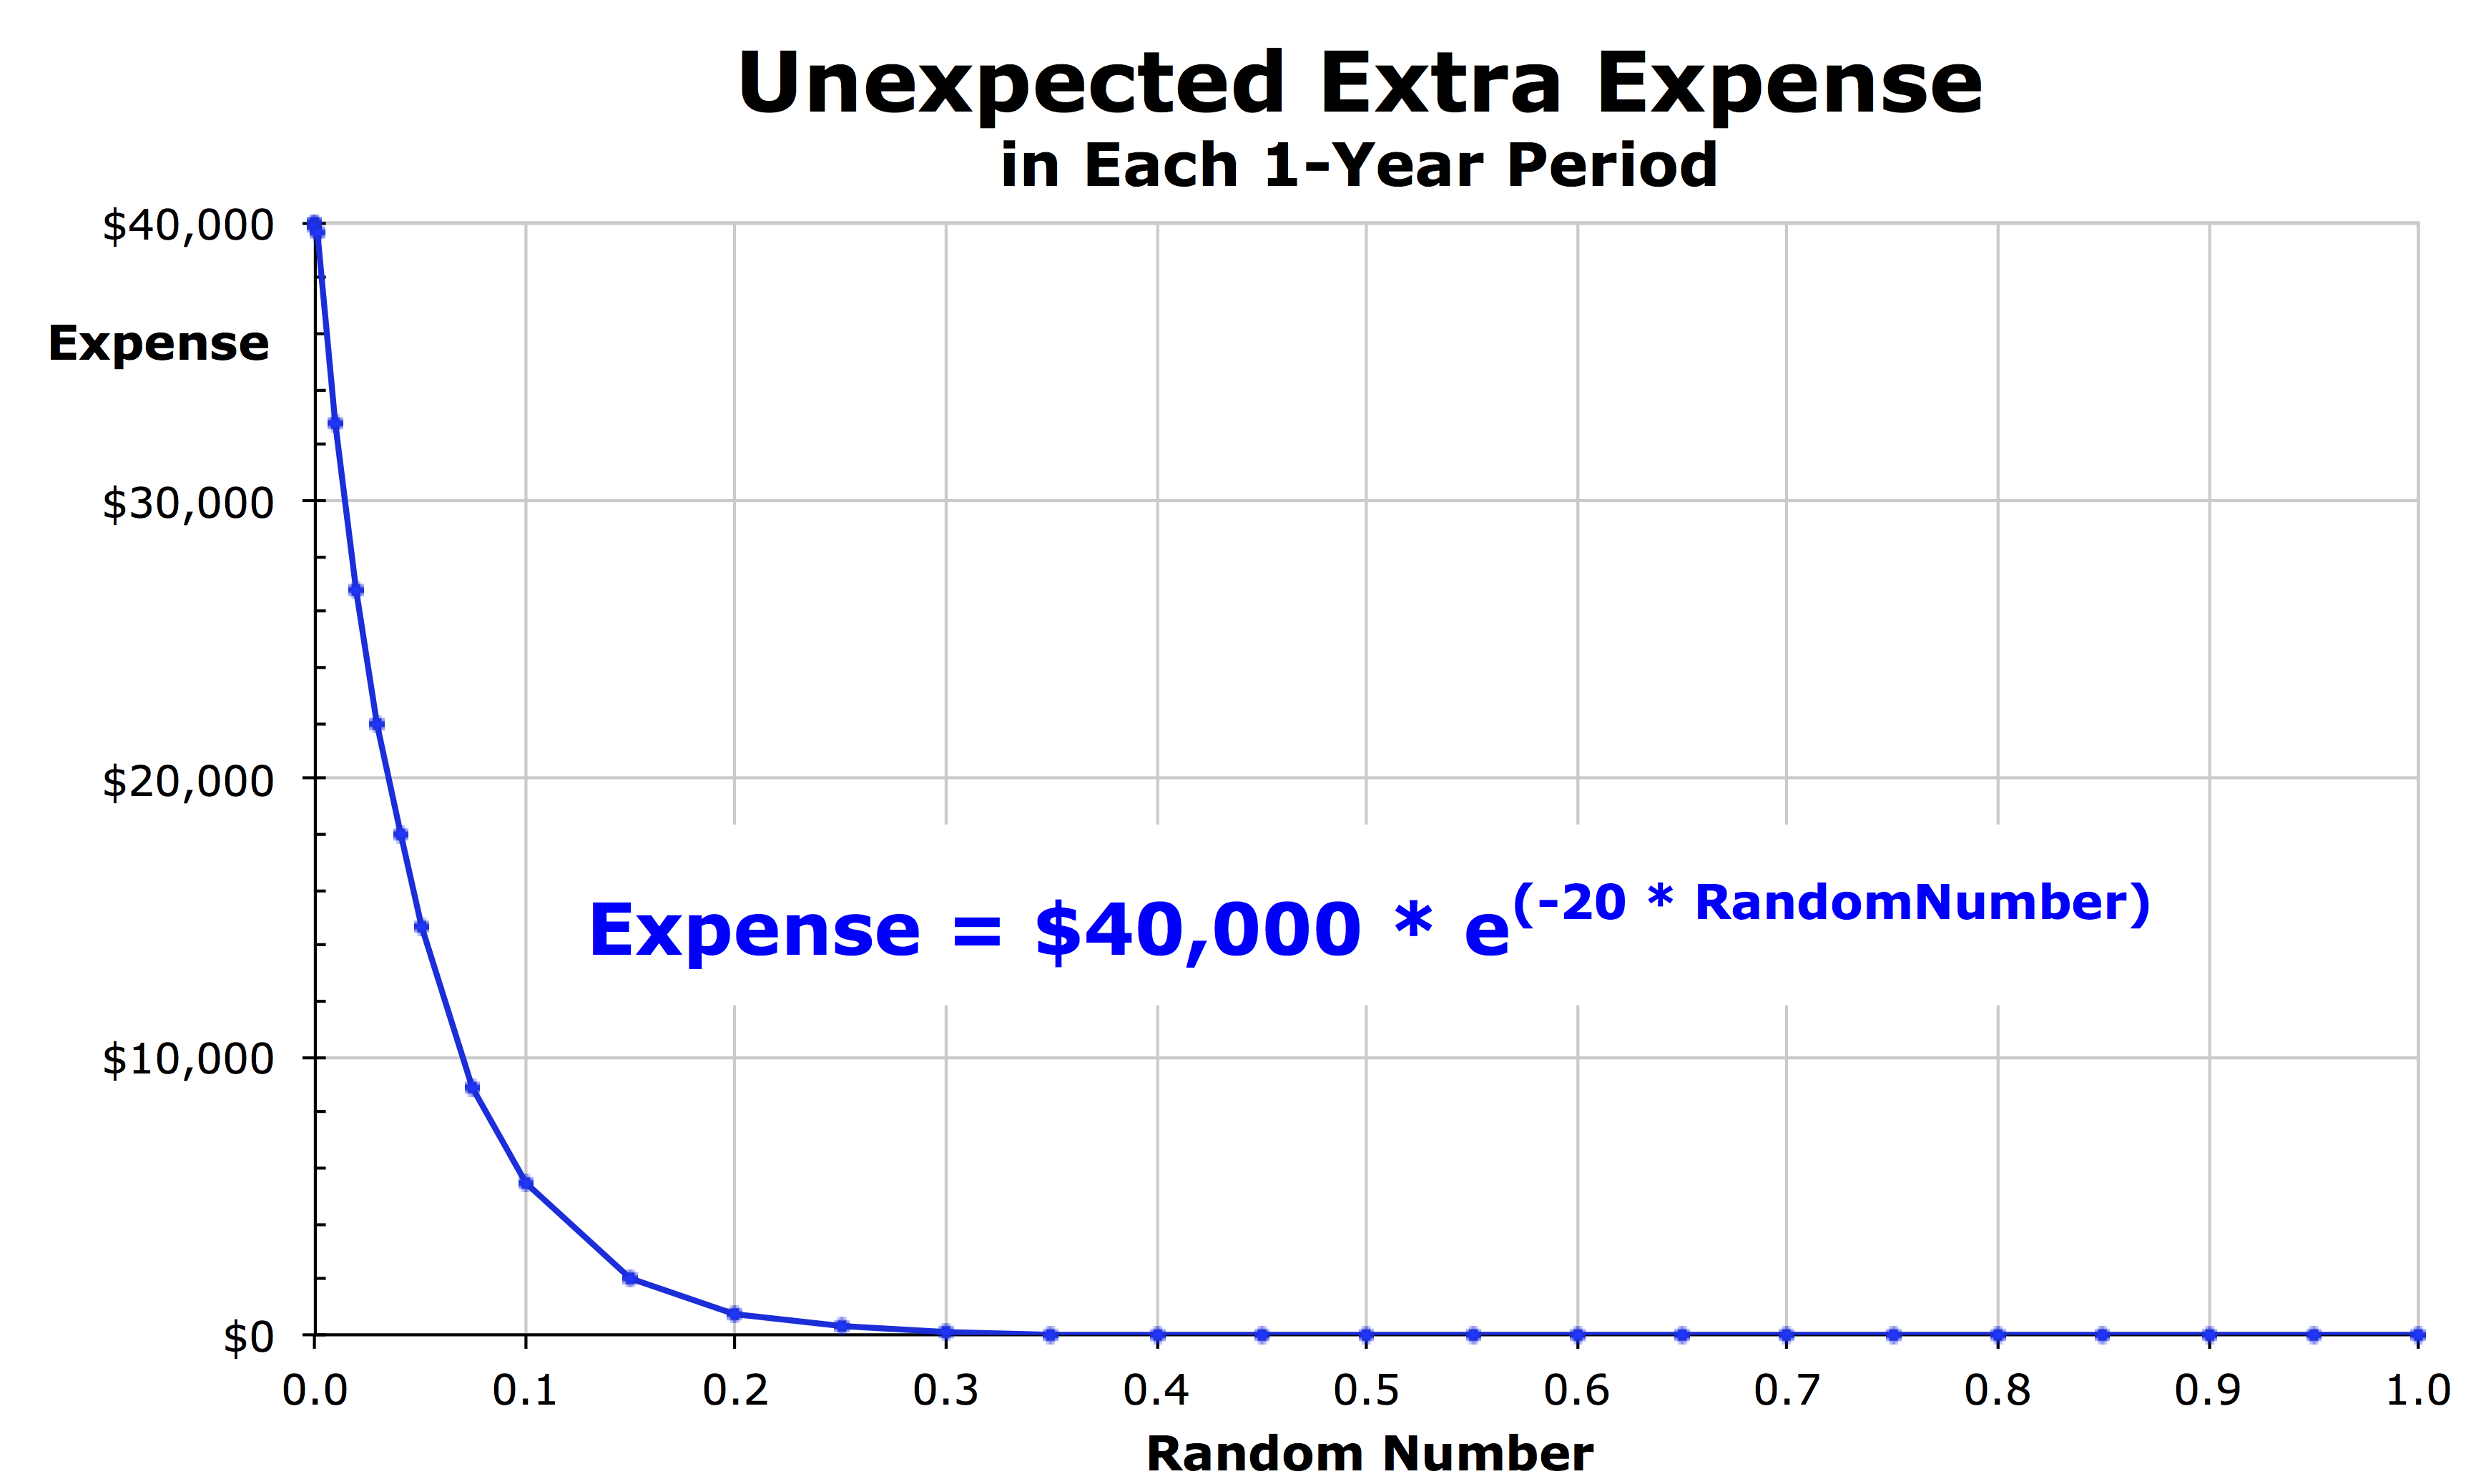
Expense = A * e^(c*x)
Here “^” means “raised to the power of”, “*” means “multiply”, “x” is a random number between 0 and 1, “e” is the Euler mathematical constant (the base of the natural logarithm and is equal to about 2.71828), “A” is the maximum expense/loss (when x=0), and “c” is a parameter with a negative value that determines how steeply the curve decreases towards zero as x increases. To see how varying the parameters for this function affect its values and shape, see the spreadsheet called ExponentialDecay on GoogleDocs.
Skewed Island Initial Household Wealth
To devise the initial household wealth values for Skewed Island, we created a wealth distribution curve for the United States in 2016 using data from the Survey of Consumer Finances prepared by the United States Federal Reserve Bank and summarized on the website DQYDJ. We then interpolated and extrapolated that data to create 500 household wealth data points that had roughly the same distribution as the U.S. For our calculations, see the spreadsheet called SkewedIslandInitial on GoogleDocs.
Parameters (shown here with the values for Combo Island)
These parameters have been specifically chosen to highlight certain properties of a society so we can learn about the development of wealth inequality. But they also are similar to contemporary values in the United States (in fact, often more generous and forgiving than in the U.S.)
- IntialWealth = $205,000 (Wealth in Year 0 for every household)
- HouseValue = $200,000 (Value of house)
- AnnualWorkIncome = $60,000 (Annual income from working to manufacture something, grow food, extract resources (lumber, oil, etc.), provide a service, etc.)
- AnnualOrdinaryExpense = –$54,000 (Annual expenses from purchasing food and energy, buying clothes and other goods that have worn out, paying for services, etc.)
- MaxExtraExpense Maximum = –$40,000 (Maximum extra expense from injury or illness)
- LuckParameter1 = –20.0 (Parameter used to calculate extra expenses)
- MaxCatastrophicLoss =–$200,000 (Maximum loss if struck by a natural disaster (tornado, hurricane, flood, wildfire, earthquake, landslide, etc.) or severe illness or injury)
- LuckParameter2 = –50.0 (Parameter used to calculate the catastrophic loss)
- InterestRate = 3.00% (Annual rate of interest charged on debt and offered for cash loaned)
- BankruptcyFloor = $0 (Wealth amount under which wealth is reset)
- BankruptcyResetLevel = $150,000 (After bankruptcy, amount at which wealth is reset to)
- TaxThreshold = $250,000 (Wealth level above which tax is levied)
- TaxRate = 10.00% (Annual tax rate on wealth above TaxThreshold)

The Formulas
Here is a description of each of the main formulas on each worksheet of the ChancyIslandsModel spreadsheet:
Worksheet “Wealth”
The wealth amount at the end of each year is equal to the wealth at the end of the previous year plus the yearly gain from all sources, or if the wealth amount in the previous year was less than the bankruptcy floor, then it is reset to the bankruptcy reset level and then the gain is added. Specifically:
Wealth = IF( PreviousYearWealth < BankruptcyFloor, BankruptcyResetLevel, PreviousYearWealth ) + Gain
Worksheet “CashWealth”
CashWealth = Wealth – HouseValue
Worksheet “Gain”
Gain = AnnualWorkIncome + AnnualOrdinaryExpense + ExtraExpense + CatastrophicLoss + Interest + BnkrptcyFee + TaxNBonus
Worksheet “ExtraExpense”
ExtraExpense = TRUNC( MaxExtraExpense * EXP( RAND()*LuckParameter1 ), 0 )
The RAND function produces a random number between 0 and 1. Since LuckParameter1 is a negative number, the EXP function drops off rapidly when the random number is close to 1. The TRUNC function reduces the cost to the nearest dollar (and reduces it to $0 for many households).
Worksheet “CatastrophicLoss”
CatastrophicLoss = TRUNC( MaxCatastrophicLoss * EXP( RAND()*LuckParameter2 ), 0 )
Worksheet “Interest”
If the household’s cash wealth in the previous year is less than 0, then the household must pay interest on that negative amount. If the cash wealth is greater than 0, then the household receives interest payments equal to the cash wealth in the previous year times the annual interest rate times the portion of all loans made in the previous year divided by all the cash wealth available for making loans in the previous year. Specifically:
Interest = IF( PreviousCashWealth < 0, PreviousCashWealth * AnnualInterestRate, PreviousCashWealth * AnnualInterestRate * –PreviousLoanDemand/ PreviousLoanAvailable )
The values of PreviousLoanDemand and PreviousLoanAvailable are calculated using the SUMIF function at the bottom of the “CashWealth” worksheet. Specifically:
PreviousLoanDemand = SUMIF(AllHouseholdsPreviousYear,"<0")
PreviousLoanAvailable = SUMIF(AllHouseholdsPreviousYear,">0")
Worksheet “BnkrptcyFees”
An equal bankruptcy fee is paid by each household. This fee is equal to the total debt forgiven at the end of the previous year divided by the number of households (which is 500). Specifically:
BankruptcyFee = PreviousTotalDebtForgiven / NumberHouseholds
The total amount of debt forgiven in the previous year is the difference between the wealth for each household in the previous year whose wealth was lower than the bankruptcy floor and the bankruptcy reset level. It is calculated using the SUMIF function at the bottom of the “Wealth” worksheet by summing all of the wealth amounts in the previous year that are less than the BankruptcyFloor and then adding the product of the bankruptcy reset level and the number of bankruptcies. Specifically:
PreviousTotalDebtForgiven = –SUMIF(AllHouseholdsPreviousYear,
"<"&BankruptcyFloor) + NumberBankruptcies*BankrutpcyResetLevel
The number of bankruptcies is calculated using the COUNTIF function. Specifically:
NumberBankruptcies = COUNTIF(AllHouseholdsPreviousYear, "<"&BankruptcyFloor)
Worksheet “TaxNBonus”
A wealth tax is paid by each household whose wealth at the end of the previous year was greater than the tax threshold and is equal to their household wealth in the previous year minus the tax threshold times the tax rate. An equal tax bonus is paid to each household every year. It is equal to the total taxes collected in the previous year divided by the number of households (which is 500). Specifically:
TaxNBonus = IF( PreviousWealth >= TaxThreshold, –(PreviousWealth–TaxThreshold)*TaxRate, 0 ) + PreviousTotalTaxAmount / NumberHouseholds
The total amount of taxes collected in the previous year is the difference between the wealth for each household in the previous year whose wealth was greater than the tax threshold and the tax threshold. It is calculated using the SUMIF function at the bottom of the “Wealth” worksheet by summing all of the wealth amounts in the previous year that are greater than the TaxThreshold and then adding the product of the TaxThreshold and the number of households taxed. Specifically:
PreviousTotalTaxAmount = –SUMIF(AllHouseholdsPreviousYear, ">="&TaxThreshold) + NumberTaxed*TaxThreshold
The number of households taxed is calculated using the COUNTIF function. Specifically:
NumberTaxed = COUNTIF(AllHouseholdsPreviousYear, ">="&TaxThreshold)
 Previous