 The Chancy Islands
  Menu
Menu
From Each According to their Ability, To Each (Borrowing) According to their Need
Debt Island is identical to Rugged Island except for one very important difference. Seeing the large number of people on Rugged Island who became destitute (and had “negative” wealth) from hardship caused by events beyond their control, the people of Debt Island attempted to lessen the misery by allowing anyone who has cash wealth to loan money to those needing it.[1] The people of Debt Island also came up with a uniquely fair and compassionate implementation of this solution (that also just happens to be easy to model in our spreadsheet).
Loan Details
Every household on Debt Island that has cash wealth (net worth greater than the $200,000 value of their home) offers that money at 3% interest to any resident who has cash wealth of less than $200,000 (and thus needs a loan). The funds available for borrowing would presumably be in the form of a home equity loan for households with a need less than the $200,000 value of their home and for an outright loan for those households whose needs are greater than $200,000 (who have already mortgaged their homes for the complete $200,000 value).
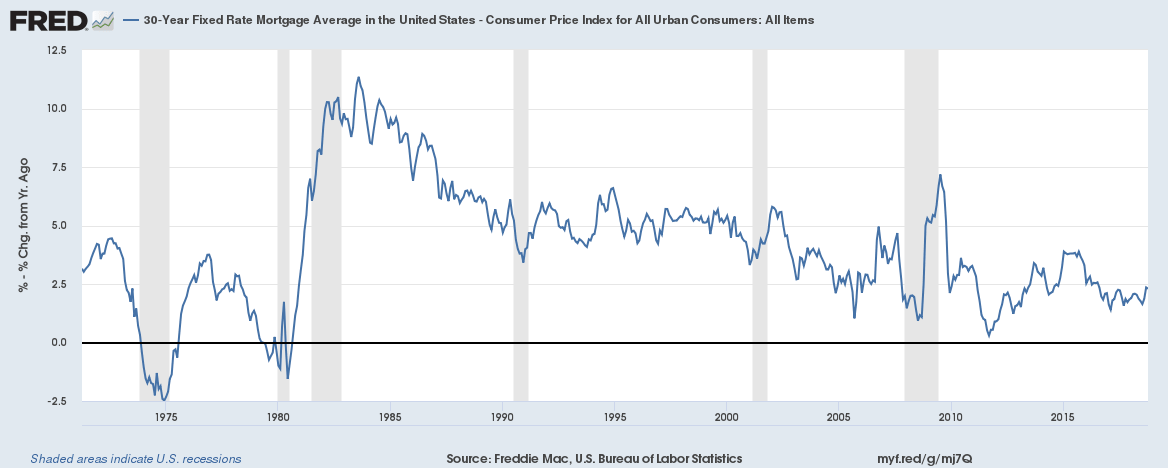
The 3% annual interest rate is comparable to the amount for a long-term home mortgage (above inflation) in the United States[2] and is not, by anyone’s definition, a predatory rate — luckily for the Debt Islanders, their island is not called “Loan Shark Island.”[3]
The total amount loaned is determined by the overall need. A share of the total amount is provided by every household in direct proportion to how much cash wealth each household has available. In short: every household with a cash surplus helps every household with a need in direct proportion to their needs and abilities — with 3% annual interest charged to borrowers for this service and 3% interest paid to lenders to provide it.
See details for Calculating Loan Interest.


Results
Perhaps surprisingly, allowing needy households to borrow money and those with extra cash to offer loans makes the wealth stratification on Debt Island even worse than on Rugged Island! A seemingly benign effort actually turns out to be quite harmful.[4]
Middle Luck Households
Some households have both good luck and bad which balances out over time. These households have total wealth in Year 50 of a little more than the $205,000 they began with or with a little less.
Poor Households
The households that have a string of bad luck, which greatly reduces their net worth, then must also pay interest on their loans which makes their finances even more difficult. As on Rugged Island, by Year 50, more than 200 of the 500 households (40% of the total) have less net worth than it takes to own a house outright (less than $200,000). And at some point during the 50 years, typically more than 100 households (20% of the total) have their net worth drop below $0. In the set of runs shown here, in Year 50 the poorest household has negative net worth of –$1.2 million (brown point in the lower left corner). This household has incurred massive loans, which subject it to massive annual interest charges. The loans are so large that the household will likely never be able to repay them.
Rich Households
The households that are blessed by good luck throughout the study period now also collect interest so their wealth grows significantly. By Year 50, about 100 households (20% of the total) have accumulated more than $500,000 in wealth, and 30 (6%) have more than $615,000 — three times as much as they began with. In the set of runs shown here, the richest household has garnered $776,000 (brown point in the upper right corner).
Wealth Stratification
Though total wealth for all of Debt Island remains roughly constant, some lucky households become quite wealthy while those who suffer from a string of bad luck lose all their wealth, and then incur massive loans — wealth becomes severely stratified. By Year 50, the combined wealth of the richest 10% of households ($33 million) has soared and the combined net worth of the poorest 50% of households is negative (–$15 million).
Measures of Wealth Inequality
These common measures of wealth inequality are dramatically skewed, showing very steep stratification.
| Value | |
|---|---|
| Range (wealth of richest household minus poorest household) | $2,017,000 |
| Gini Coefficient | 0.92 |
| Hoover Index (Robin Hood Index) | 0.66 |
| Coefficient of Variation | 1.68 |
| Quartile Coefficient of Dispersion (Q3–Q1)/(Q3+Q1) | 0.95 |
| Decile Coefficient of Dispersion (D9–D1)/(D9+D1) | 2.62 |
| 20:20 Ratio (ratio of wealth owned by the top 20% to the bottom 20%) | –1.78 |
| Palma Ratio (ratio of wealth owned by the top 10% to the bottom 40%) | –1.22 |
Wealth Quintiles
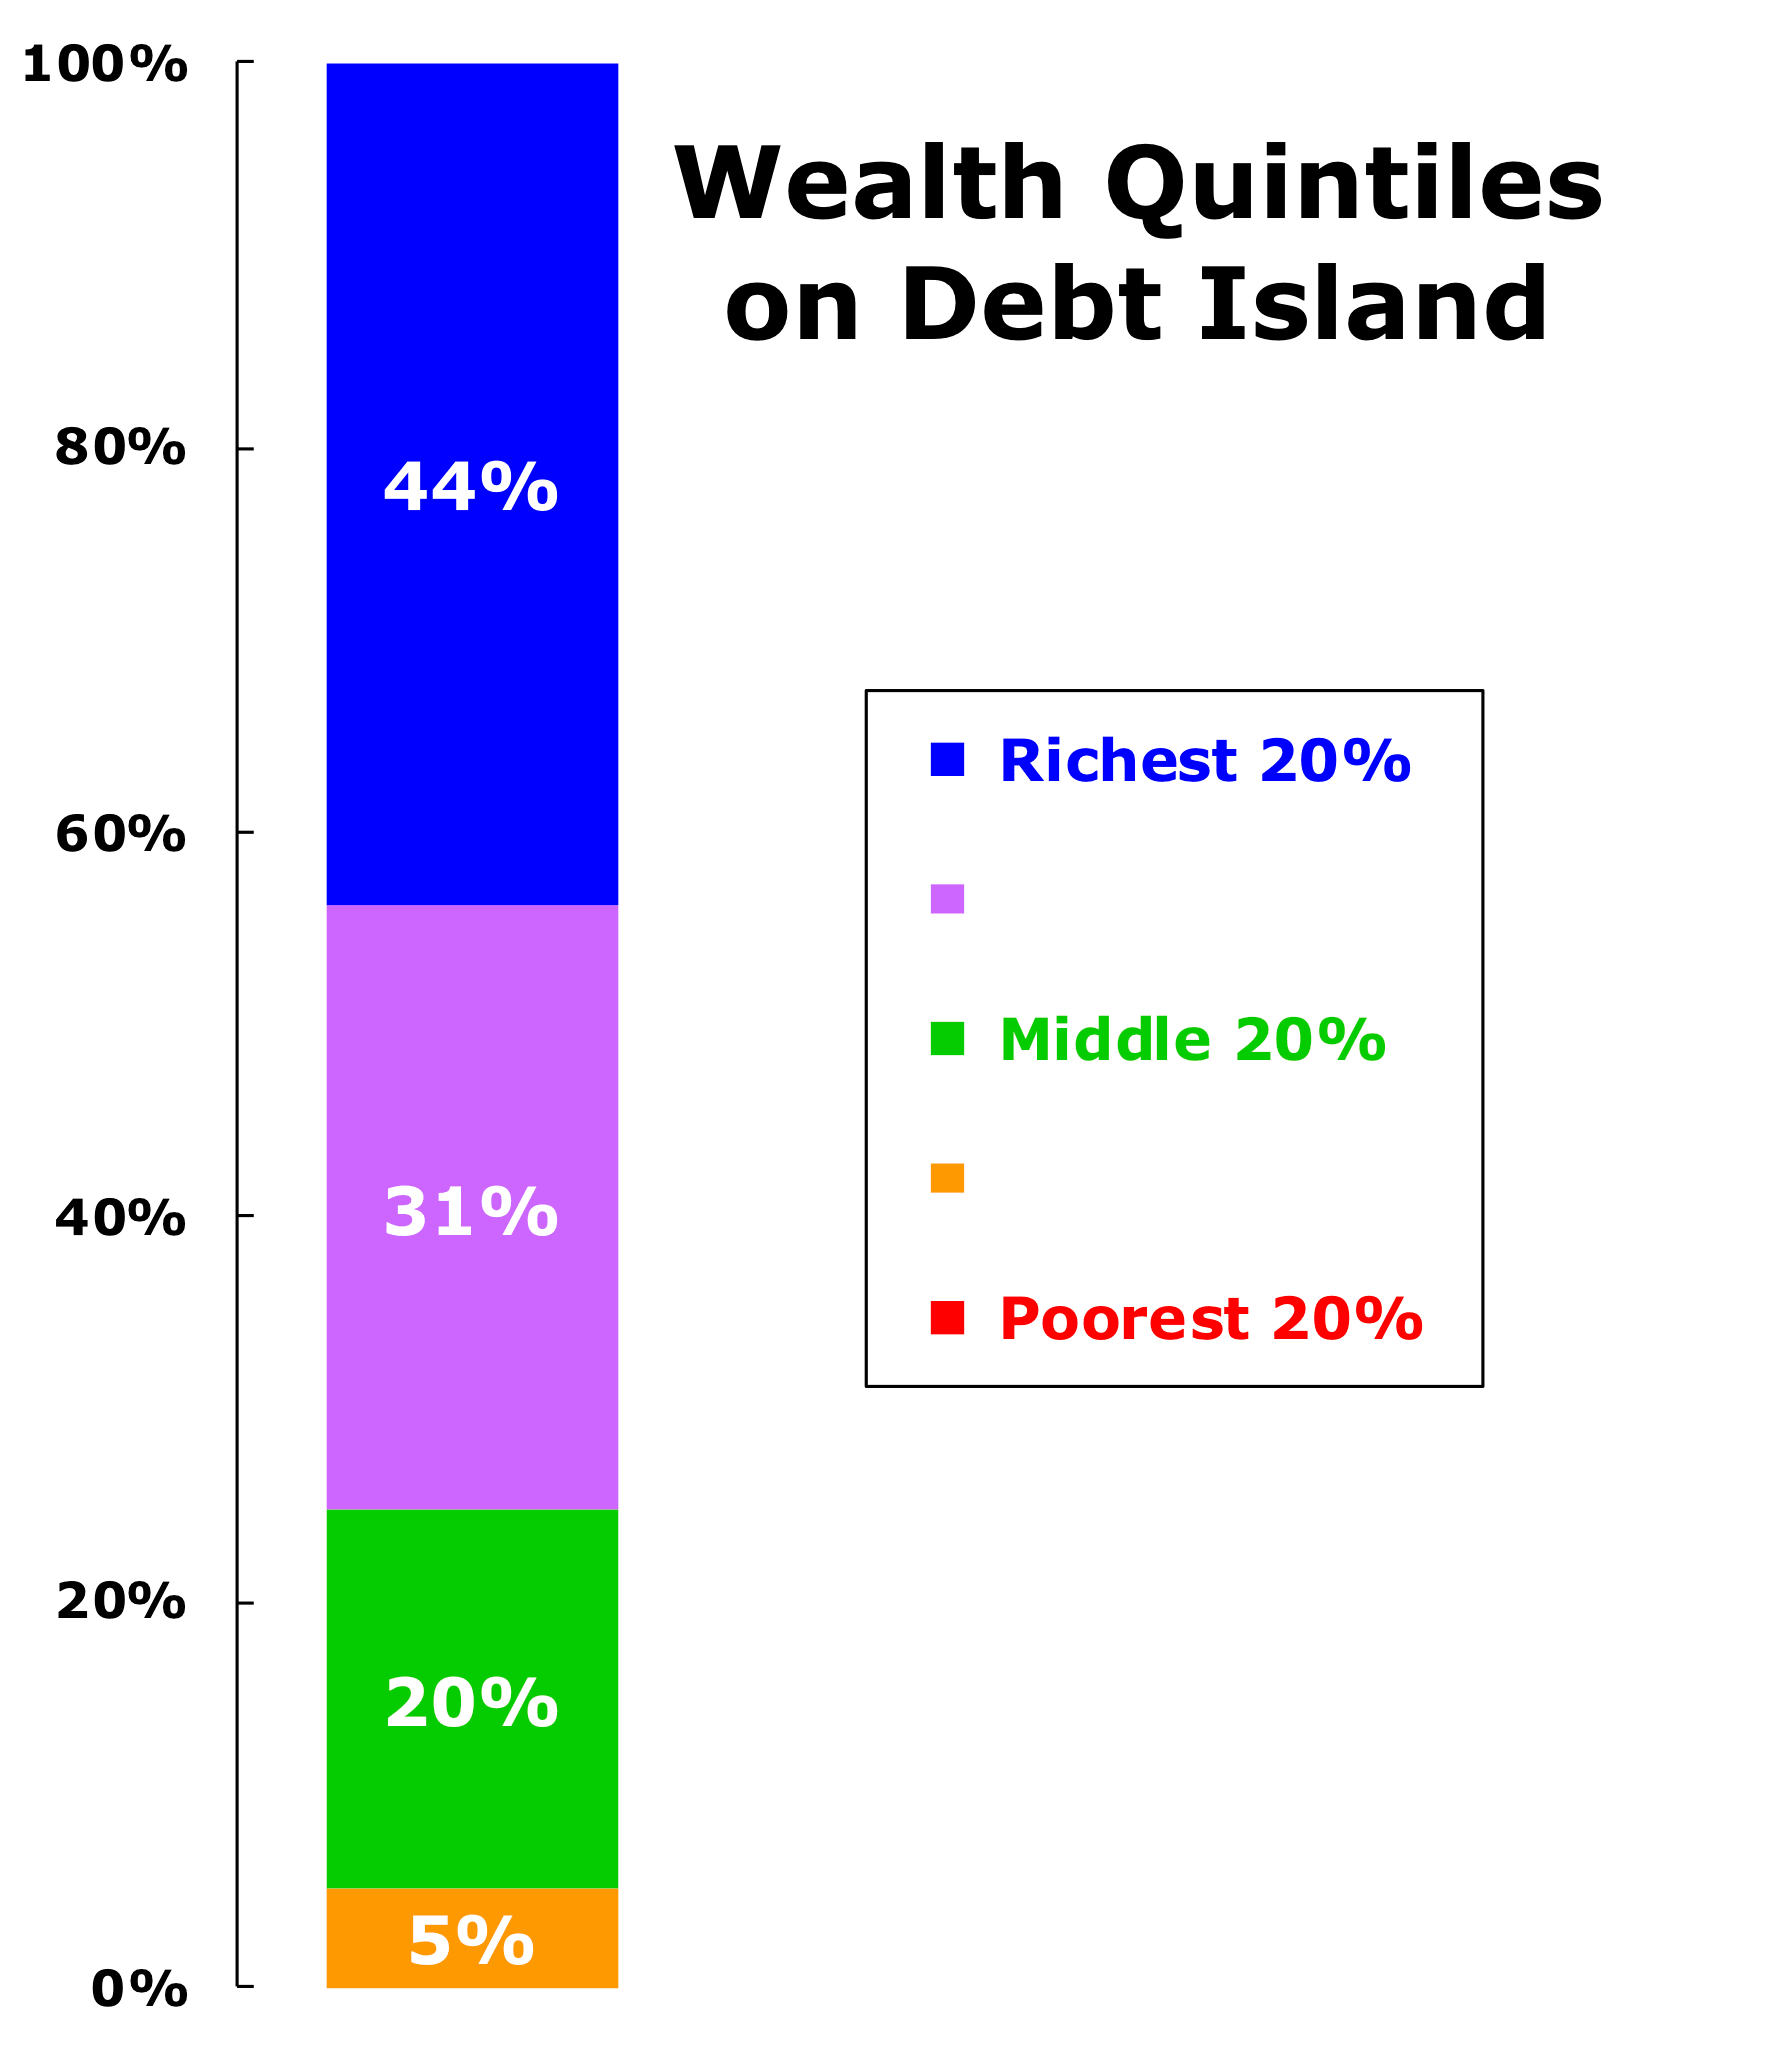 As shown in this graph of wealth held by each quintile of the households in Year 50, the richest 20% of the households (the top quintile, shown in blue) owns 44% of all wealth.[5] The next wealthiest 20% (shown in purple) owns 31%. The middle 20% (in green) owns 22%. Together, these three quantiles have 95% of all the wealth on the island, leaving a mere 5% for the poorest 40% of the households. As on Rugged Island, the poorest 20% (in red) have no wealth (they actually have massive debt) and their non-existent wealth does not display on this graph at all.
In the Future
If the model is allowed to continue, inequality spirals out of control. The wealth of the richest household grows to $2.9 million by Year 100, and the poorest household sinks to a staggering negative net worth of –$6.5 million. The combined wealth of the top 20% of households (more than $190 million) towers above the combined negative net worth of the poorest 50% (less than –$240 million). In Year 100, the top 5% of households have accumulated 59% of the total wealth and the top 10% have more than 100% (with the debt so great among many of the households that the combined net worth of the bottom 90% of households is –$8.8 million). The Gini coefficient soars to 4.05, the Hoover Index rises to 2.89, and the Coefficient of Variation shoots up to 7.38, reflecting the immense number of households with massive debt, and indicating an extremely skewed distribution.
Presumably, as time continues on, wealth on this island would grow even more stratified and the poor would be overwhelmed with ever greater debt.
Timing
Precisely when in the first 50-year period households are struck with good or bad luck is often fateful.
Those households which are struck by a particularly expensive disaster or a string of large expenses early in the 50-year period immediately lose much of their wealth and, in response, must take out large loans. Once burdened by these large loans, they can never really recover because of the high interest costs they must pay every year. In contrast, both those households which never incur large costs during the 50-year span and those which have managed to accumulate a large financial nest egg in the early years before they are struck by a large disaster do not have to take out large loans. They are able to pay for whatever losses they incur from their cash savings, and they can go on to accumulate a fortune from their substantial yearly interest earnings. Pure luck determines early wealth, and then early wealth determines later wealth: the early rich get richer while the early poor get even poorer.
So two different kinds of luck are determinant for the people of Debt Island: (1) the overall random bad luck of suffering from accidents, illnesses, natural disasters, and other large expenses (or the good luck of having few of these) and (2) the random luck that determines when they are struck by these expenses.
Conclusion
Even though everyone on Debt Island has equal talent and exerts equal effort, massive wealth stratification develops just as it did on Rugged Island. Furthermore, Debt Island makes very clear that offering loans to the poor (and charging interest they can’t repay) actually makes their situation much worse and makes the rich vastly richer, thus greatly increasing stratification. This stratification continuously grows over time. Offering loans does solve one problem with the model: it eliminates the absurdity of “negative wealth” in a situation where there are no loans and no debt.
Debt Island also shows that the luck of timing is fateful: generally, those struck early by misfortune are forever burdened by massive loan interest payments while those who can accumulate financial resources before any misfortune strikes are then forever blessed by rising income from their loan interest earnings.
Next Stop
The rest of the islands consider Debt Island a disaster and have implemented additional measures that work much better to keep wealth inequality in check. Our next stop is Mercy Island.
 Previous
Notes
1. ^
In addition, this change rectifies the odd presence of “negative wealth” (which really makes no sense without borrowing). On Debt Island (and all of the remaining Chancy Islands we’ll visit), when a household has negative net worth, it means that it owes more than the value of its house and cash holdings.
2. ^
From July 1971 to July 2018, the annual mortgage interest rate in the United States, calculated monthly and adjusted for inflation, ranged between –3% and 12%. The average for these 47 years was 4.1%.
3. ^
Even just increasing the interest rate to 6% leads to vastly more wealth inequality. With 6% interest the wealthiest household would have accumulated more than $1.6 million by Year 50. More than 100 households (20% of the total) would have more than $1 million. The poorest household would have an overwhelming negative net worth of –$5 million. Over 160 households would have negative net worth and more than 100 (20% of the total) would have net worth of less than –$500,000. The Gini Coefficient would be 2.71 and the Hoover Index would be 1.96.
4. ^
In the real world, of course, short-term debt allows poor people to overcome temporary expenses that might sink them otherwise. When the situation is really dire — when poor people cannot afford food and shelter — debt allows them to continue consuming so they don’t die. However, debt that simply enables basic consumption does not reduce inequality. Debt may reduce inequality if it provides investment or working capital to those who lack wealth but have innovative ideas.
In the real world, people who must borrow money usually reduce their consumption to the barest essentials. In contrast, in the Chancy Island model households continue to consume at exactly the same rate no matter how low their wealth falls (and so they never risk dying from a lack of food). This is a case that clearly shows that the Chancy Islands model is very simple and does not actually simulate the real world — it shows us only what happens in the stark situation we have defined in the model. Still, the model does demonstrate the larger point that any measure that increases costs for poor people and funnels their money to the rich will increase wealth inequality.
5. ^
Because there is so much debt on Debt Island (every household in the bottom 20% has net wealth of less than $0 and, together, hold –32.8% of the total wealth), these quintile values are actually the “percent of positive wealth” (excluding the debt). The richest 20% hold 58.3% of all wealth (including negative wealth).