 The Chancy Islands
  Menu
Menu
Numerical Results
The table below shows the final numerical characteristics and indicators of inequality for each of the seven fictitious Chancy Islands as well as Skewed Island in Year 0. Click on the table to see a printable, full-screen version. Or view it as a GoogleDoc spreadsheet.

Table Notes
A yellow background indicates the input parameters that have changed from the previous column.
Flat Island has a tan background to indicate that it is different from the other islands since all households there have identical and uniform luck.
Skewed Island has a light violent background to indicate that, unlike the other islands in which all of the households have the same initial wealth of $250,000, the 500 households on Skewed Island have variable and widely skewed initial wealth that mimics the United States in 2016 as calculated in this spreadsheet.
Skewed Island in Year 0 is also shown here (with a green background).
Here are definitions of the main measures of wealth inequality.
Graphs
Below is a graph of Gini Coefficients for the seven islands in Year 50, plus (in green) the Gini Coefficient for Skewed Island in Year 0. Note that Flat Island has perfect equality, so its Gini Coefficient is 0.

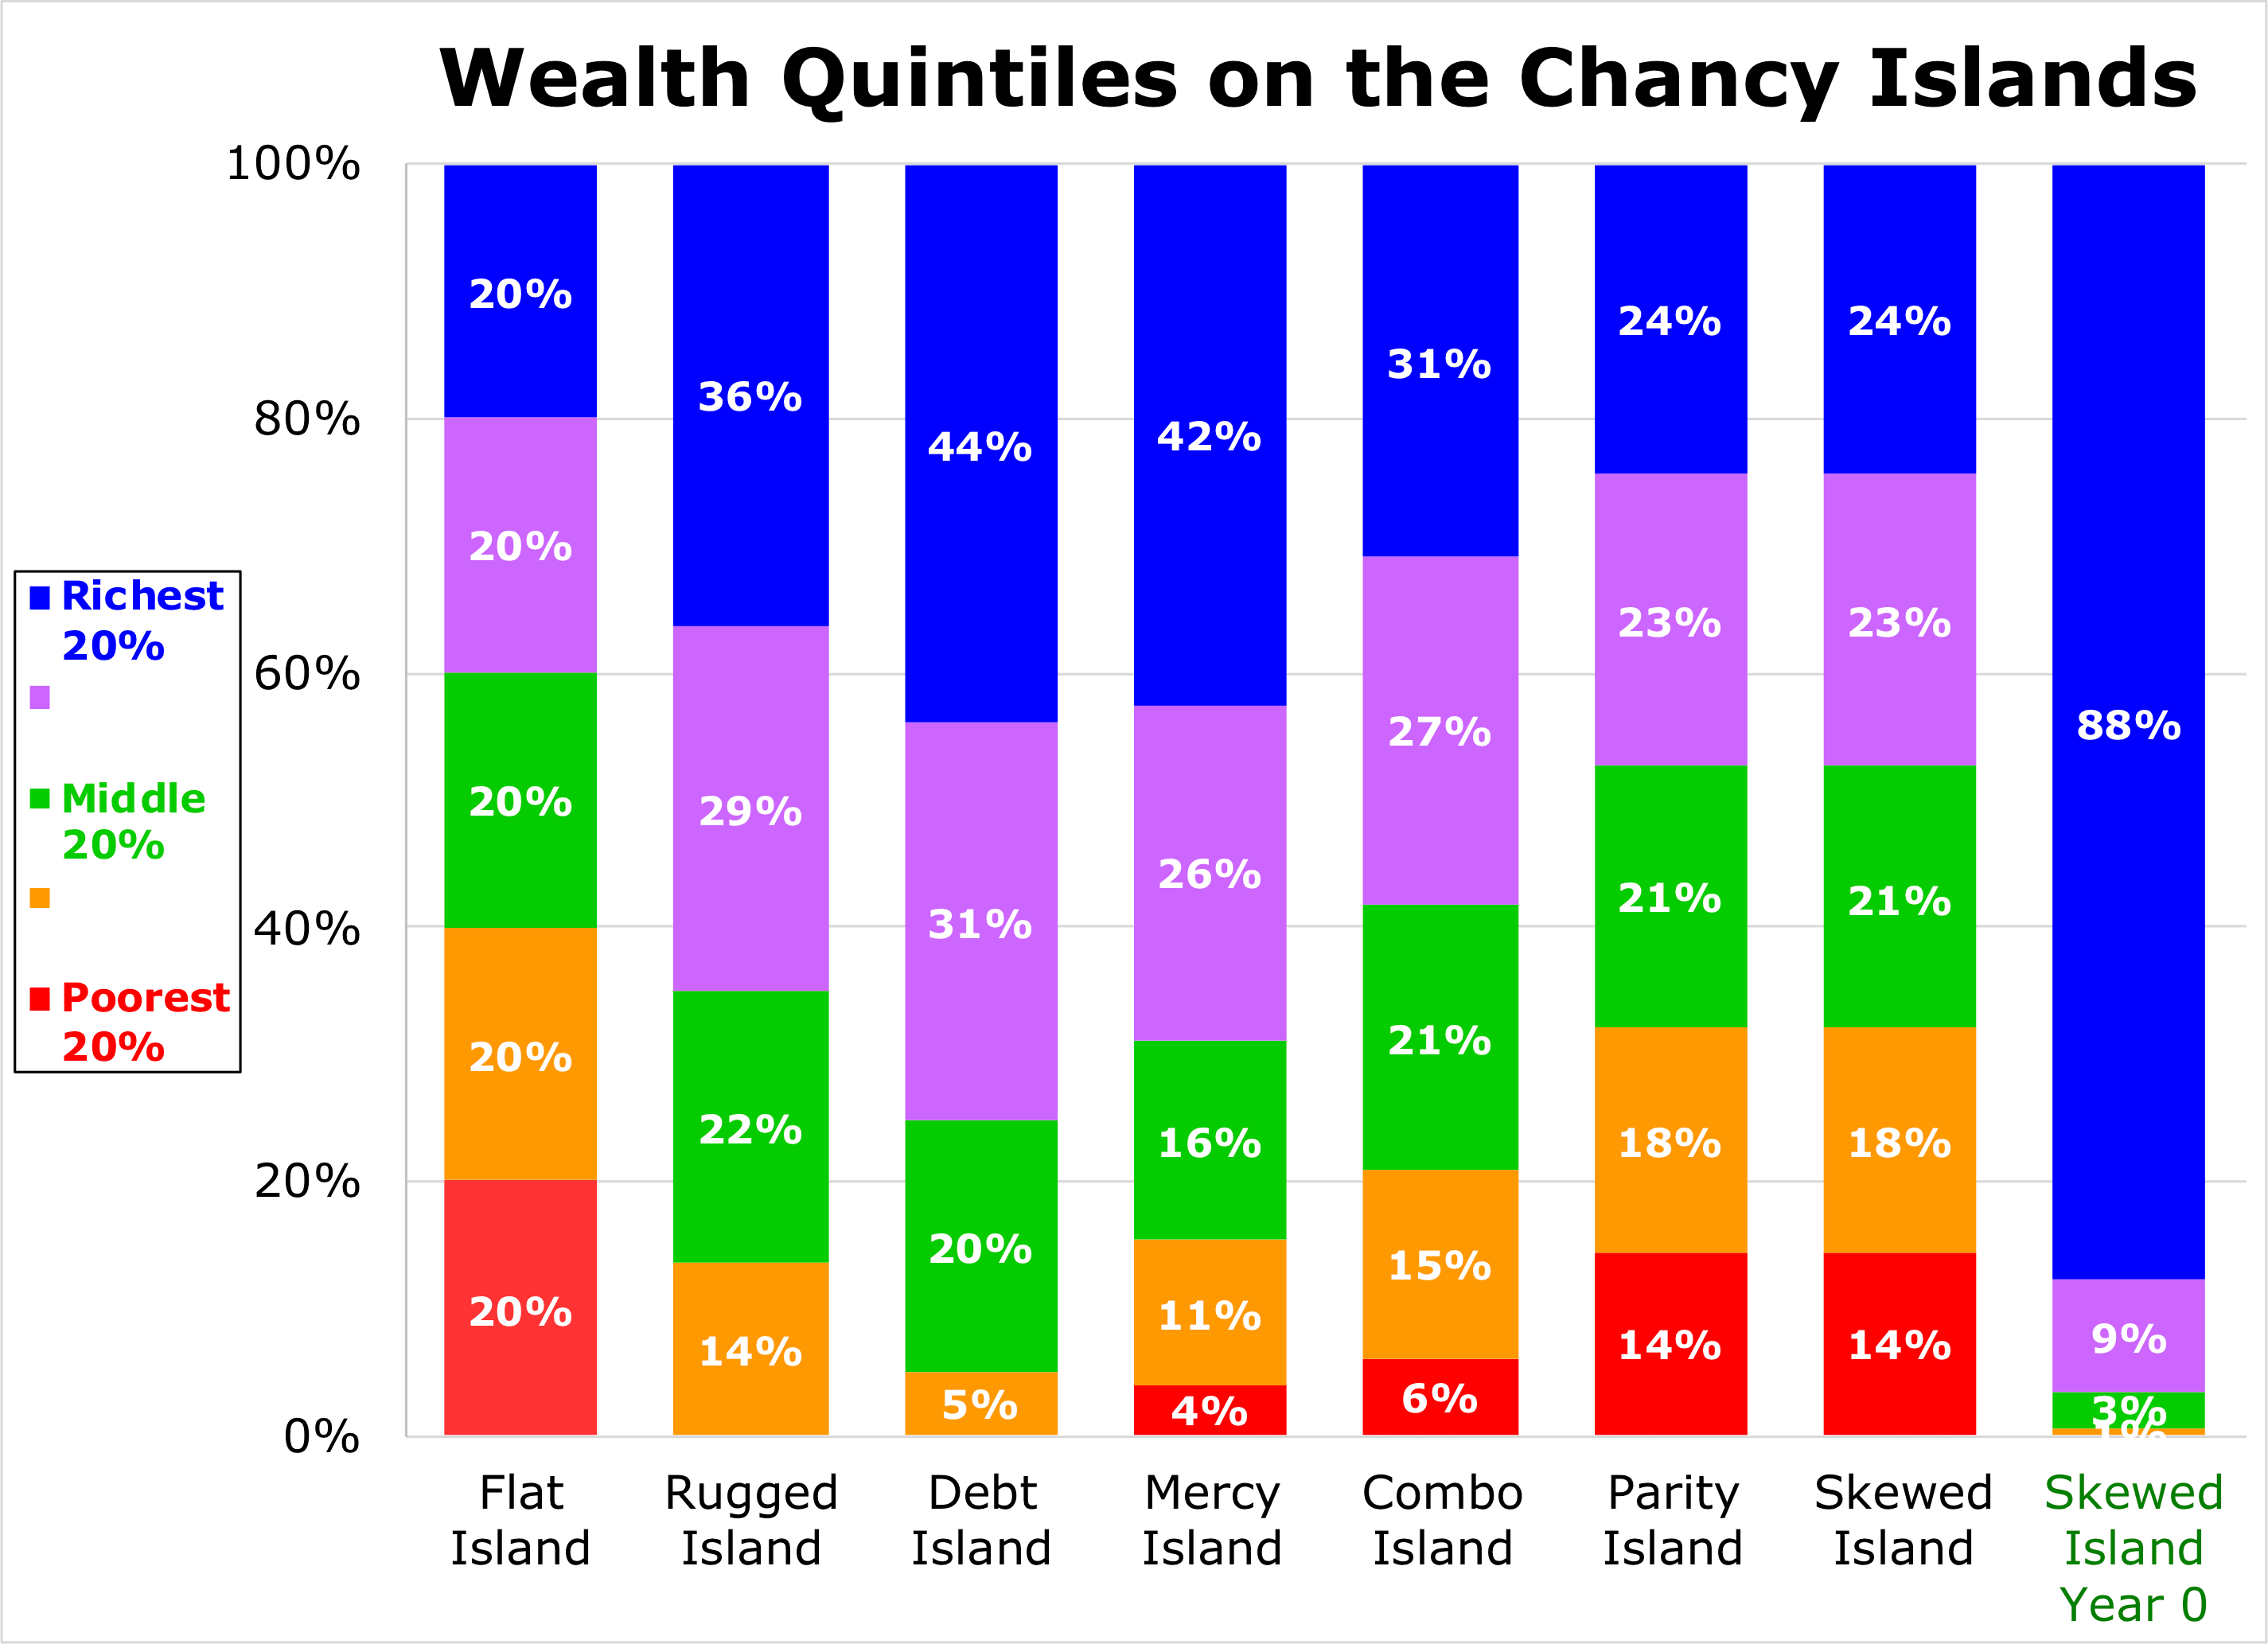
The graph below shows the percent of total wealth[1] held by each quintile of the households in Year 50 for the seven islands and Skewed Island in Year 0.

 Previous
Notes
1. ^
Because there is so much debt on several of the islands, especially those in which every household in the bottom 20% has net wealth of less than $0, these quintile values are actually the “percent of positive wealth” (excluding the debt). See Footnote 5 on the Debt Island page and Footnote 4 on the Rugged Island page for more.